MBTA Performance Metrics Dashboard
MBTA Performance Metrics Dashboard features four interactive dashboards that track and display transportation performance metrics including reliability, ridership, customer satisfaction, and accuracy.
MBTA (The Massachusetts Bay Transportation Authority) is the public agency responsible for operating most public transportation services in Greater Boston, Massachusetts.
View the project, click here.

Year
2022
Tools
Tableau Desktop
Tableau Prep
HTML / CSS
My Role
As part of the project, I played the roles of designer and front-end developer. As a designer, my responsibilities included designing the visualizations and dashboard layouts. My role as a developer was to implement the design by developing the dashboards in Tableau Desktop.
The project was a collaborative project between different departments within MBTA, I also worked closely with data administrators and MBTA website content team to communicate and coordinate about design/develop and publish the dashboards.

Dashboards
MBTA Performance Metrics Dashboard project features four interactive dashboards including the Reliability Dashboard, the Ridership Dashboard, the Customer Satisfaction Dashboard, and the Accuracy Dashboard. The Subway Trip Time Dashboard is part of the Reliability dashboard.
The dashboards use commonly used visualizations to make performance data easily accessible to the general public. A variety of times and levels of information were displayed through interactivity.
To explore each dashboard, click on the image.
The Reliability Dashboard

The Ridership Dashboard

The Customer Satisfaction Dashboard

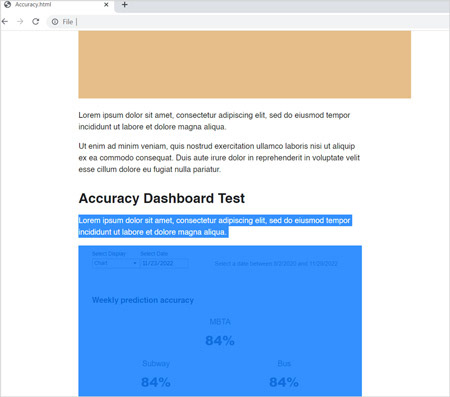
The Accuracy Dashboard

Challenges & Solutions
#Challenge#
This project requires the dashboards to be seamlessly integrated into the hosting webpage (mbta.com) and to be optimized for both large screens and mobile devices.
However, this presented a challenge to our team. Since this project involved cross-departmental collaboration, In order to test out layout, resizing feature, and desktop/mobile switch of the dashboard, we needed to send each version's dashboard embed code to the website department and waited for a preview link to perform the test. This process significantly increased the time cycle of iterations.
*Solution*
My solution was to study and mimic the underlying HTML/CSS code of the hosting web page and create a testing environment. As a result of this testing site, our team was able to internally test out the dashboards and improve the design quickly.

Hosting webpage layout
Testing webpage layout
#Challenge#
the Subway Trip Time Dashboard shows average trip times for MBTA subway lines. Due to the Orange Line shutdown between mid-August and mid-September, there is no trip time data available for the Orange Line visualizations during the period. The data shortage issue should be addressed properly in the dashboard and clearly communicated to users.
*Solution*
As part of the solution, I designed a function that when a user selects any date during the shutdown period, the Orange Line visualizations are removed and an explanation message is displayed instead. Tableau calculations and filters were used to create the function on the dashboard.
Design the Subway Trip Time Dashboard
As part of the Subway Trip Time Dashboard project, I participated in all phases. During the initial phase, I played the role of an information designer to design the dashboard from scratch.
Entry Point
The dashboard's landing page was designed to present simple, digestible information. Scaled numbers on the left shows the average trip time for the selected date, to provide highly summarized data, allowing the user to quickly grasp the information.
The sparklines on the right show a 30-day trend in trip time. This sparkline was selected to emphasize only the pattern of change in trip time over the past 30 days. Sparkline's simplicity and minimalism provides the user an easy way to understand the trip time trend.
Landing page: an entry point to the dashboard
Providing only the first layer of information to general riders, the landing page functions as an entry point to the dashboard. Information that was more complex and granular was designed to place on the dashboard's "View line detail" page.
Interactive Tool
On the "View line detail" page, trip time data is displayed at a more granular level. It was designed for users who wish to explore the data in more detail and have a greater interest in it.
In order to serve as an exploratory and analytical tool, more interactive functions were added to this dashboard page.

An analytical tool to explore the data in more detail
As requested by stakeholders, the dashboard showed "7-day moving average trip time" and "two directions' daily trip time", resulting in three lines on the chart and cluttering the view. A filter was designed to toggle between different metrics on the dashboard and make it easier for the user to interact with it.
To meet the demand from the user for more accurate data numbers, another filter was created that switches between chart and table views on the dashboard.
