Hotel Manager Dashboard
An interactive dashboard for hotel managers to access key operational and management information. This project was collaboratively developed with a real hotel manager in accordance with the principles of user-centered design.
Interact with the dashboard, click here.
Year
2022
Tools
Tableau Desktop
R
Roles
User Researcher
Information Designer
Tableau Specialist
Brief
Creating an interactive dashboard for the client, who is a front desk manager at a hypothetical hotel. The dashboard should help the client to access key information needed to perform day-to-day operational tasks and to achieve specific objectives.
This is a personal project. Read on for more information about the design process.

Research & Interview
The client is a hotel front desk manager. Daily tasks for the client include monitoring key information for operations and staff management, identifying guests with certain characteristics for marketing, and accessing performance data.
In order to assess the client's dashboard needs, a series of interviews were conducted with the client to identify the specific goals and tasks they wish to accomplish using the data.
The client's needs and requirements, including, but not limited to:
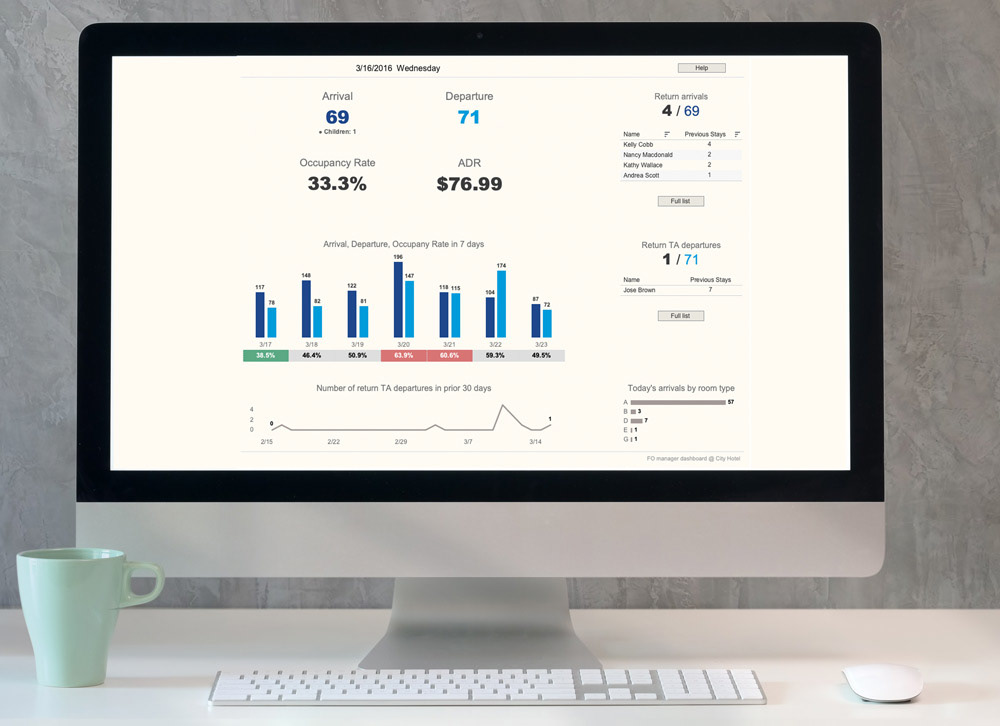
⦿ Key information must be monitored are today’s arrival, departure, occupancy rate, and ADR (Average Daily Rate) for operations management. Data for the next 7 days of the above KPIs for staff management.
⦿ For customer service and marketing, the dashboard needs to identify all return guests among today's arrivals and return guests booked through travel agencies (return TA) among today's departures.
⦿ The dashboard needs to display historical data for the number of return TA departures for performance management.
⦿ The dashboard need to be updated daily and hosted only on desktop computers.
As a result of the research and interview, design choices such as the use of graphs, layouts, and interactivity can be made.
Sketch & Iteration
In the form of sketches, an initial concept of the dashboard design was presented to the client. With the sketches, we were able to work with the client to improve the design further.
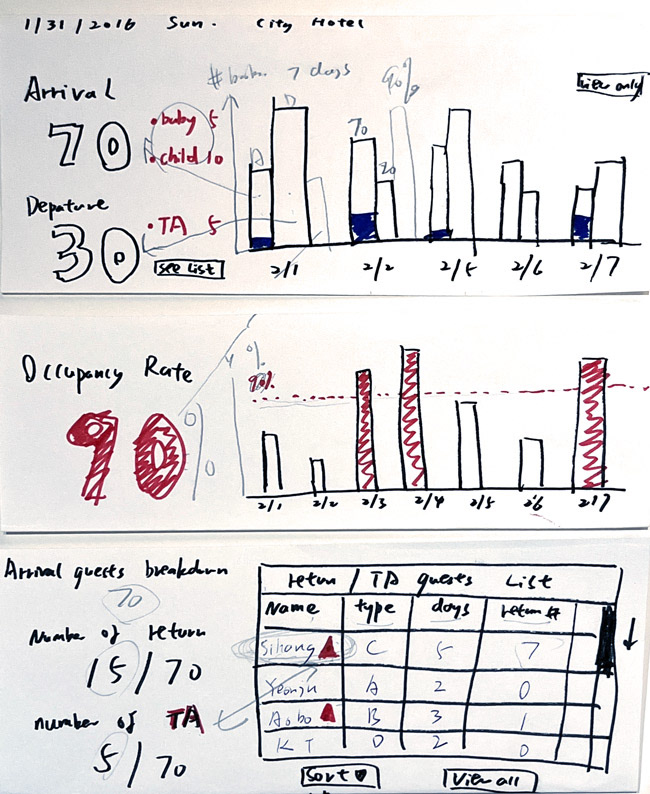
First sketch - initial concept
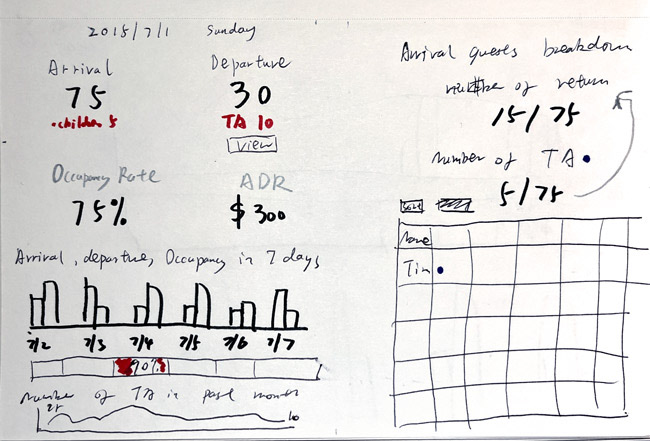
Second sketch - improved layout
After receiving feedback from the client and understanding the client's mental model when using the information, the design was iterated several times and moved to development.
Data transformation
The data set used for this project was obtained from Kaggle.com. The data set contains 119390 observations representing hotel bookings between the 1st of July 2015 and 31st of August 2017. All data elements pertaining hotel or costumer identification were deleted.
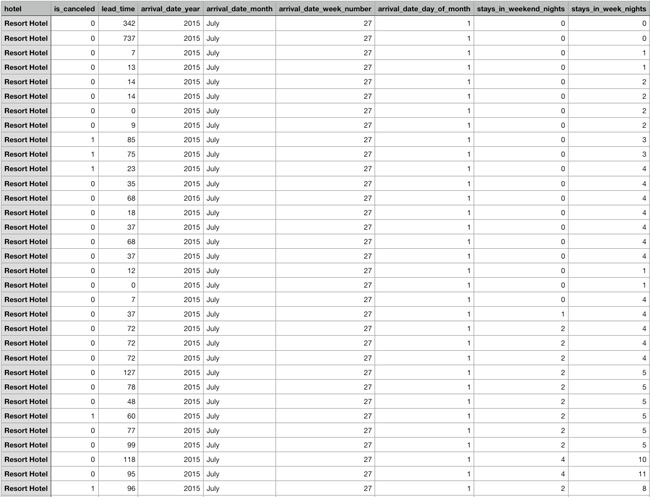
R was used for the calculation and transformation of data into the appropriate format.
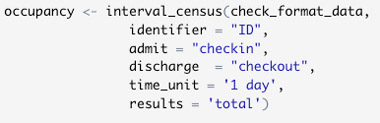
Among all the data transformations, the biggest challenge was to calculate the daily occupancy rate. A hotel's occupancy rate considers both new arrivals as well as in-house bookings. This data set, however, only provides daily new arrivals and does not provide accumulated in-house bookings over time.
Luckily, the library(patientcounter) in R provided a simple and quick solution to calculation daily occupancy rate.
Other calculations and transformations were performed to prepare the best possible data format for Tableau dashboard development.
Development
The dashboard was developed in Tableau Desktop. Several calculations were made to deliver the desired view, including logical and level of detail calculations.
